What Is Graphify? How It Turns Your Codebase Into a Knowledge Graph for Claude Code
You open a project you have never seen before. Maybe it's your first week at a software house, or a university assignment built on someone else's repository. You ask your AI assistant, "How does login work here?" It starts opening files one by one, searching for keywords, and slowly piecing together an answer. It works, but it's slow, and it burns through context. Graphify is built to fix that. It builds a map of your project once, so the assistant can look up connections instead of rediscovering them every time.
This guide covers what Graphify is, how it works, how to do a Graphify install, and where it falls short.
Table of Contents
3. How Graphify Builds the Graph
4. What You Get After Running It
5. Graphify Install: Step by Step
6. Using Graphify With Claude Code
8. What the Benchmarks Say, and What They Don't
What Is Graphify?
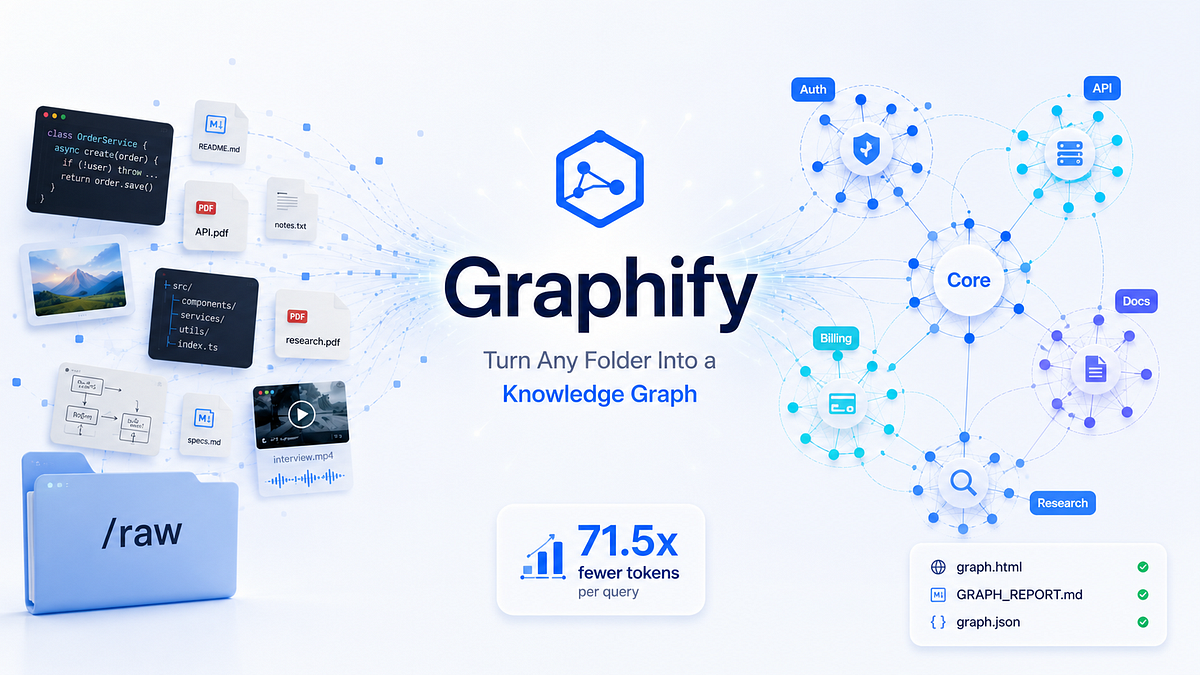
Graphify is an open source tool that turns a folder into a knowledge graph. According to its official repository, you type /graphify inside your AI coding assistant, and it maps your project into a graph you can query instead of grepping through files. That includes code, docs, PDFs, images, and video. A knowledge graph is a network of things and the relationships between them. In a codebase, the "things" are functions, classes, files, and concepts. The relationships are statements like "this function calls that one" or "this file imports that module."
Graphify works with Claude Code, Cursor, Codex, Gemini CLI, GitHub Copilot, and more than a dozen other assistants. This article focuses on Graphify Claude Code, since that's the most common pairing. The project is a Y Combinator S26 company, and its GitHub repository has passed 120,000 stars. That level of attention makes it worth understanding, but popularity is not proof it suits your project. Test it yourself.
The Problem It Solves
Out of the box, Claude Code explores a repository by reading files and running searches. That's fine for small projects. On a large codebase, a few things go wrong:
It spends tokens re-reading files it has already seen in earlier sessions.
It can miss connections between files that don't share obvious keywords.
Every new session starts with no structural memory of the project.
A knowledge graph gives the assistant a persistent map. Instead of asking "Which files mention authentication?" it can ask, "What connects the login route to the database?" and follow the links.
How Graphify Builds the Graph
Three main steps happen behind the scenes.
1. Local code parsing. Code is parsed with tree sitter, which analyzes the structure of your source files. Per the project's README, this step is deterministic and uses no LLM, and nothing leaves your machine. It resolves links such as calls, imports, and inheritance across roughly 40 languages.
2. A semantic pass for everything else. Documents, PDFs, and images can't be parsed like code. For those, Graphify uses your assistant's model to pull out concepts and relationships.
3. Clustering. The finished graph is split into communities, which are groups of closely related nodes that usually match real subsystems like "payments" or "authentication."
One detail I like is how it handles trust. Every connection is tagged EXTRACTED (explicitly present in the source) or INFERRED (worked out by Graphify). Some are marked AMBIGUOUS. You can always tell what was read directly and what was a good guess. It is also not a vector database. It has no embeddings or vector store. You get an actual graph that you traverse, which is a different approach from typical RAG setups.
What You Get After Running It
A single run produces a graphify-out/ folder with three files:
File | What it's for |
graph.html | An interactive map you open in a browser. Click nodes, search, and filter by community. |
GRAPH_REPORT.md | A readable summary: key concepts, surprising connections, and suggested questions. |
graph.json | The full graph, which can be queried later without rereading your files. |
The report highlights "god nodes," the most connected concepts that everything flows through. For a new team member, that list alone is a quick way to learn which parts of a codebase matter most.
Graphify Install: Step by Step
You need Python 3.10 or newer and a supported assistant such as Claude Code.
One thing to get right: the official PyPI package is named graphifyy with a double "y." The README warns that other graphify* packages on PyPI are not affiliated with the project. The command you run is still graphify.
Step 1: Install the package.
uv tool install graphifyy
If you prefer pipx:
pipx install graphifyy
Step 2: Register the skill with Claude Code.
graphify install
Step 3: Build your first graph.
Open Claude Code inside your project and type:
/graphify .
On Windows PowerShell, use graphify without the slash, because PowerShell reads a leading slash as a path separator.
If you see "command not found": your shell probably doesn't have the install folder on its PATH yet. Running uv tool update-shell and opening a new terminal fixes it in most cases. Avoid plain pip install on Mac or Windows where possible. The README recommends uv or pipx because they isolate the package and prevent environment mix-ups.
Using Graphify With Claude Code
Once the graph exists, you can query it directly:
/graphify query "what connects auth to the database?"
/graphify path "UserService" "DatabasePool"
/graphify explain "RateLimiter"
Each command does a different job:
Query answers a plain-language question with a focused piece of the graph.
Path traces the shortest route between two concepts.
Explain shows one concept and everything linked to it.
Making Claude use the graph automatically
Run this once in your project after building a graph:
graphify claude install
This adds a section to your CLAUDE.md file and installs a hook that fires before search style tool calls. When a graph exists, Claude gets a nudge to check it before grepping raw files. If you want it firmer, there's a strict mode. Running graphify install --project --strict blocks the first raw source read of a session and redirects it to the graph, then goes back to the soft nudge. It only fires once per session, so it can't trap the assistant.
Keeping the graph fresh
A map that's out of date is worse than no map. Graphify offers a few options:
Graphify hook install rebuilds the graph automatically on each commit and branch switch. Code rebuilds use local parsing, so there's no API cost.
After a git pull or merge, run graphify update . to sync.
/graphify ./docs --update refreshes only changed documents.
If you work in a team, the README suggests force-adding graph.json and GRAPH_REPORT.md to git so teammates can query the same graph without rebuilding it.
Who Is This For?
Students. If you're learning from an open source project or inheriting a group assignment, the report and the interactive graph make unfamiliar code far less intimidating. You can see the structure before reading a single function. You can also build a graph of a well known repository and study how real projects are organized.
Software house teams. Onboarding is expensive. A shared graph helps new developers find the central modules faster, helps reviewers see what a change might touch, and gives Claude Code consistent context across sessions. The tool also has a PR dashboard (graphify prs) that shows review status and graph impact for pull requests, which may appeal to team leads.
Business and project managers. You don't need to run it yourself to benefit. The GRAPH_REPORT.md is plain Markdown. A developer can generate it, and you can read it to understand how a system is structured before planning work.
What the Benchmarks Say, and What They Don't
The README publishes a set of benchmarks. On one test using the ERPNext codebase, key fact coverage was 82.0% for Graphify versus 70.8% for a grep and read baseline. That's a useful signal, but look at the sample size: the table lists it as n=6. Six questions is a small test, so treat it as encouraging rather than conclusive. The project also reports zero LLM credits for building a graph from code, since code parsing is local.
The full tables and reproduction commands are in the repository's BENCHMARKS.md if you want to check the numbers yourself.
Limitations to Know Before You Start
No tool fits every situation, so here are the honest trade-offs.
It helps with reading code more than writing it. An independent reviewer who tested Graphify on three codebases made this point too: graph queries are great for understanding a codebase but not for editing one. Claude still reads raw files when it needs to change them.
Documents and images need a model. Only code is parsed fully locally. PDFs, docs, and images go through an LLM, which means API usage or your assistant's session.
Graphs need upkeep. Install the git hooks, and remember to run graphify update . after pulling.
Large graphs get heavy. For graphs with more than 5,000 nodes, the HTML view can become too big for a browser. The README suggests skipping it with --no-viz and querying the JSON directly.
Watch the cache. Because Graphify writes output files into your workspace, add graphify-out/ and graph.json to a .claudeignore file. Otherwise, the README notes that each rebuild can invalidate Claude Code's prompt cache.
A Note on Privacy
For code, nothing leaves your machine, and the README states there's no telemetry. Queries are logged locally to a file in your cache folder, and you can turn that off with an environment variable. If you work under strict data rules, review the privacy section of the README first. Docs and PDFs go to whichever model you've configured, and some backends route to servers in other countries.
References
Frequently asked questions
What is Graphify?
Graphify is an open source tool that turns a folder of code, docs, PDFs, and images into a queryable knowledge graph. You run it with the /graphify command inside an AI coding assistant such as Claude Code, then query the graph instead of searching files one by one.
How does Graphify work with Claude Code?
After you run graphify install, Claude Code can use the /graphify skill. Running graphify claude install adds a CLAUDE.md section and a hook that nudges Claude to check the knowledge graph before searching raw files.
How do I do a Graphify install?
You need Python 3.10 or newer. Run uv tool install graphifyy (note the double y), then graphify install to register the skill. After that, type /graphify . inside your project in Claude Code to build the graph.
Why is the Graphify package called graphifyy?
The official PyPI package name is graphifyy with a double y. The command you run is still graphify. The project warns that other graphify packages on PyPI are not affiliated with it, so always install graphifyy.
Is Graphify free and open source?
Yes, the Graphify repository on GitHub is released under Apache-2.0 and MIT licenses, and building a graph from code runs locally with no LLM cost. The company also offers a separate hosted platform with a free trial, so check their site for current terms.
Where can I find Graphify on GitHub?
The official source repository is Graphify-Labs/graphify on GitHub. Other repositories with similar names may be forks or copies, so use the official one for installation instructions and updates.
What is an AI knowledge graph for code?
It is a map of your codebase where functions, classes, files and concepts are nodes, and relationships such as calls, imports and inheritance are the links between them. An AI assistant can follow those links to answer questions about how the code fits together.
Is Graphify the same as RAG or a vector database?
No. According to its documentation, Graphify uses no embeddings and no vector store. It builds a real graph that you traverse with commands like query, path and explain.
Does Graphify send my code to the cloud?
No for code files. They are parsed locally with tree sitter, and the project states there is no telemetry. Docs, PDFs, and images do use a model for the semantic pass, so review the privacy section of the README if you have data rules to follow.
Do I need an API key to use Graphify?
Not for code only projects. Documents, PDFs, and images need a model, which comes from your assistant session or from a key you configure, such as an Anthropic, OpenAI or Gemini key.
Which AI assistants does Graphify support besides Claude Code?
The repository lists Cursor, Codex, Gemini CLI, GitHub Copilot, OpenCode, Aider and more than a dozen others. Each has its own install command, listed in the README.
How do I keep my Graphify knowledge graph up to date?
Run graphify hook install to rebuild the graph on each commit and branch switch. After a git pull or merge, run graphify update . to sync. For changed documents, use /graphify with the --update flag.
How do I uninstall Graphify?
Run graphify uninstall to remove it from all supported platforms at once. Add --purge to also delete the graphify-out folder.